What-if analysis is a method that examines how changing the parameters affects the outcome. This analysis can be used in many areas of business, and is especially useful in the forecasting process.
What-if analysis is a procedure. The first step is to define the goal - that is, to determine which measure is the focus of our analysis. The second step is to indicate a parameter, the change of which may affect our goal (we also take into account other measures that may change when increasing or decreasing this parameter).
What-if analysis is used for forecasting and supporting the process of making the right business decisions. By testing various scenarios, we can respond to changes inside and outside the organization. Thanks to this, we can analyze both individual processes and the functioning of the entire organization.
The what-if analysis method is used in Value Driver Trees , which visualize the flow of value in the business model.

They are defined as directed graphs built of different types of nodes that are connected to each other and have mutual correlations. These nodes represent the values of measures included in the model and calculations based on these measures. This structure enables the analysis of all components of the model instead of individual KPIs and shows how the introduced changes affect not only our goal but other measures existing in the model.
SAP Analytics Cloud, which is a complete analytical platform that allows for analysis, planning and prediction, offers the creation of Value Driver Trees and provides the possibility of conducting simulations both in the wizard tool and in the report.
In the article I will present the creation and configuration of VDT (Value Driver Tree), as well as how to run simulations in the editor and how to add the object to the report.
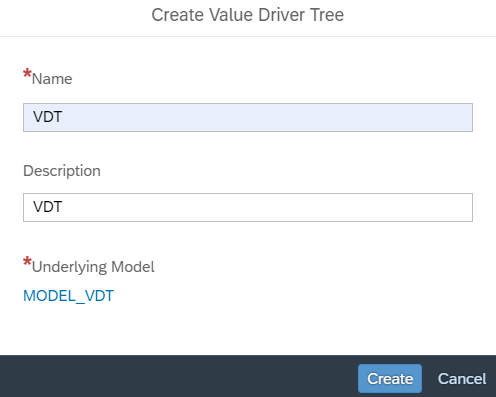
As with other processes in SAC (related to planning), we start on the home page. We create a new Value driver tree, add a name and description and select the base model:
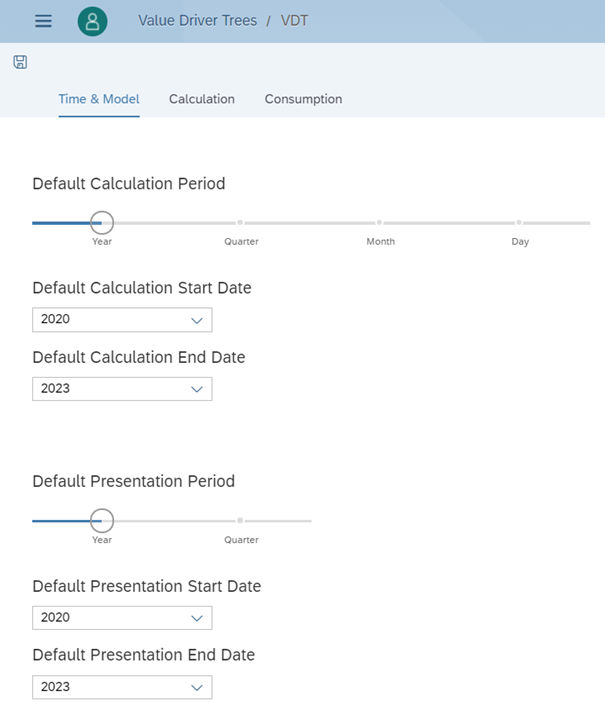
In the first tab, complete the default calculation and presentation date:
In the second tab, add nodes for which we will perform calculations. In the article I will present an example of a simulation - What if we change the sales growth factor for specific product groups and how will it affect revenues in the current and subsequent years? We will rely on data containing sales revenues of various laptop groups, where the measures\ are organized in a hierarchy and form an Account type dimension.
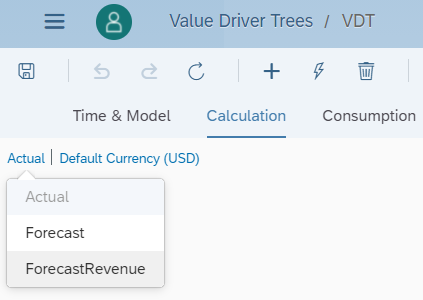
First, we select the previously created version of the forecast, for which we will save the simulation results:
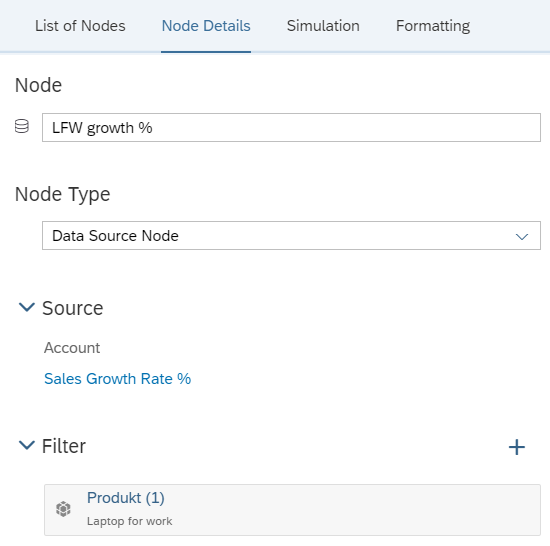
Now we add a new data source type node that provides data from the model and is used as the basis of the calculation for the other nodes. In our example, it represents a % increase for a specific product group.
Then we insert a YoY node that calculates the values for the account using the base value and growth factor. In our example, we will use this node to forecast product sales for the next years.
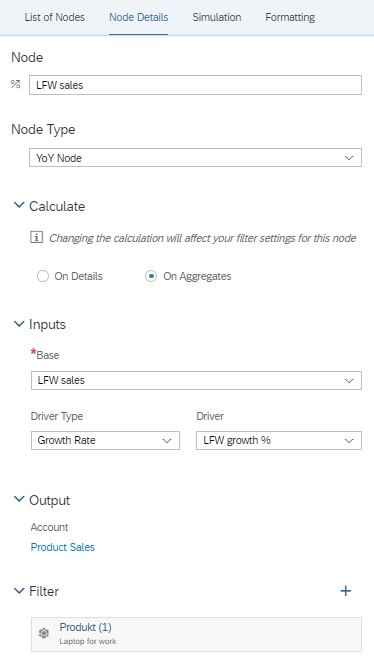
This configuration causes the nodes to be connected automatically:

We go to the last tab, which shows how VDT will be displayed in the report. Select the Reset to Calculation Flow icon:

There is also a panel called Examine in this tab. It allows you to enter the sales growth rate both in the table and in the value driver tree to run the simulation later. First, select the node, and then enter the values into the table, confirming it with the Enter key. Then go to the Simulation tab and run calculations for the selected data version.
We repeat the steps for the second product’s group and enter values indicating the rate of sales growth:
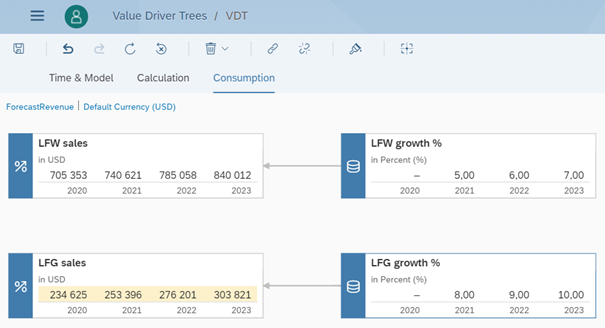
So far, we have shown how to enter values for sales growth factors and how to run a simulation in new nodes. Now we will supplement VDT with the remaining measures to see how the changed values will affect the revenues. To do this, select the auto-complete icon (lightning bolt icon) from the main menu bar in the Calculation tab. We choose the appropriate measure. Again, we fill in the growth factors and perform the calculations. As a result, we can see how the changes in the growth forecast affected the revenue figures.
The created VDT can be added to the report and simulated there as well. To add an object to the report in its existing form, first select the reset icon in the Consumption tab, and then save it using the disk icon.
In the new report, we insert VDT, and then we point to the previously defined object. In the area of the new object, we select the forecast version. We can change the values in the tree by selecting the values and increasing or decreasing it with the slider or by simply entering a specific number. After confirming the values, you can open the simulation panel and perform calculations and check again how the changes affected the total revenues.

