SAP Analytics Cloud includes many planning and prediction functionalities. Users can use the SAC platform to predict future values based on historical data.
Forecasts can be carried out in a fixed time frame, e.g. from January to December, but there is also a rolling forecast function for planning with a continuous time horizon and with a fixed number of periods.
Step 1 – prerequisites - data versions
In order to use the rolling forecast function we need a table in SAC with data intended for the forecast. In SAC, thanks to the version management function, we can create different versions of data (e.g. by copying data from one version to another). In our example we will use two versions: Actual, containing real data and Forecast, intended for forecasting.
First, we add a new canvas area page to the report and insert a table component.


In the Designer panel, we configure the table as follows:
In the Rows we select Measures , with filter on Quantity.
In the Columns we select: Version and Date.
We select two versions: Actual and Forecast.
In the last step, we filter the date by element and select all months from 2021.

Step 2 – table preparation
After inserting the table, we move on to showing the booked and unbooked data in the 12-month layout.
For the Date’s dimension, select the option of unbooked values, i.e. Unbooked Data.

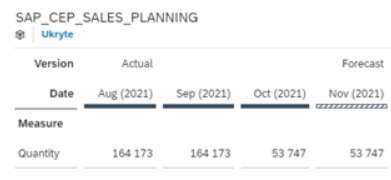
The table now shows 12 months of posted and unposted data for 2021 for both Actual and Forecast versions.
Step 3 – table layout for forecast
In the next step, we will set up the rolling forecast layout to see 2021 month by month, and configure the view of both versions.
We use the built-in forecast layout template, available under the Matrix icon in the Editor. Then the Forecast Layout configuration panel is displayed.

Step 4 – rolling forecast configuration
We have prepared the table and the layout of the forecast, we can proceed to the configuration of the rolling forecast.
For the Layout, we use the version for historical data - Actual, then the version for forecast data - Forecast. Next we will set the Cut-over date, which is the date the table will change versions between Actual and Forecast.
Next, for the Timeframefield we select the type of forecast, i.e. in our example, the Rolling Forecast. Then we define the number of periods for the historical and forecast data. Finally, we define the element for which we want to see the sum of the values in the table - in our example, the Cut-over Year.
We approve the changes by pressing Apply.

This will now set up the visualization to show 12 months of Actuals and Forecast data based on when the month of Actuals data is booked.
In this scenario we have 2 months of Actuals data and 10 months of Forecast data.


